In today’s digital world, data is everywhere — from social media likes and online purchases to sensor data and business reports. But raw data alone has no value unless we analyze it. That’s where Data Analytics comes in.
This blog will help you clearly understand what data analytics is, why it matters, its types, process, tools, and career opportunities — even if you’re a complete beginner.
What Is Data Analytics?
Data Analytics is the process of collecting, cleaning, analyzing, and interpreting data to discover useful patterns, insights, and trends that support better decision-making.
In simple words:
Data analytics turns raw data into meaningful information.
📌 Example:
An e-commerce company analyzes customer purchase data to:
- Recommend products
- Predict future sales
- Reduce customer churn
Why Is Data Analytics Important?
Data analytics helps organizations and individuals to:
- 📊 Make data-driven decisions
- 📈 Improve business performance
- 🎯 Understand customer behavior
- 🔍 Identify trends and risks
- 🤖 Power AI and Machine Learning models
Today, companies rely more on data than intuition.
Types of Data Analytics
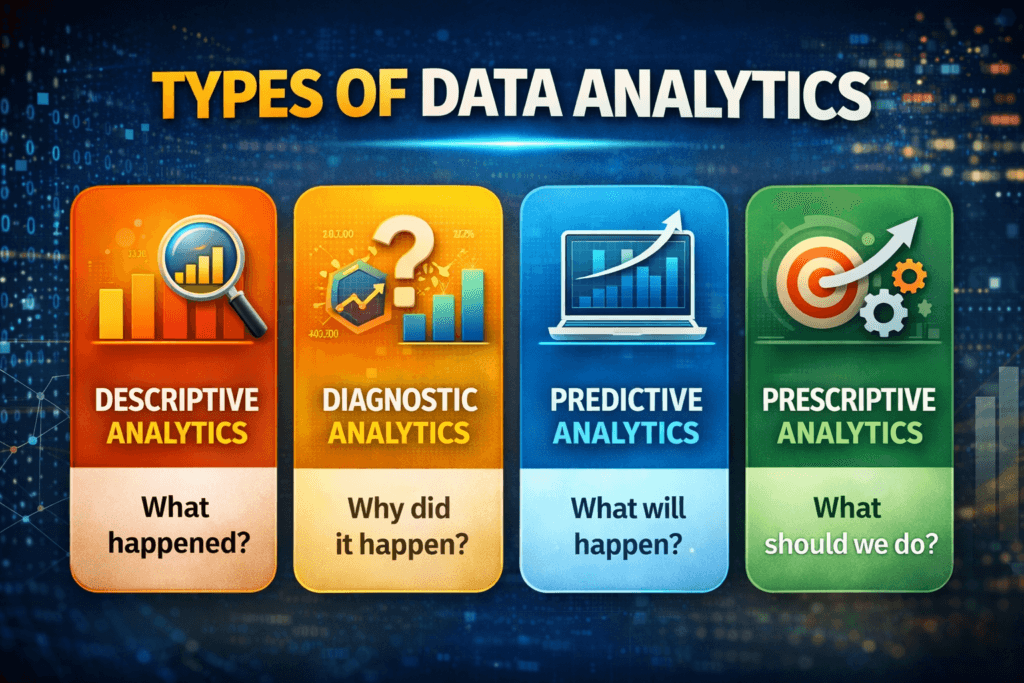
1. Descriptive Analytics – What happened?
- Summarizes past data
- Uses reports and dashboards
📌 Example: Monthly sales report
2. Diagnostic Analytics – Why did it happen?
- Finds reasons behind results
📌 Example: Why sales dropped last month?
3. Predictive Analytics – What will happen next?
- Uses statistics and ML models
📌 Example: Predict next quarter’s revenue
4. Prescriptive Analytics – What should we do?
- Suggests best actions
📌 Example: Best pricing strategy to maximize profit
Data Analytics Process (Step-by-Step)
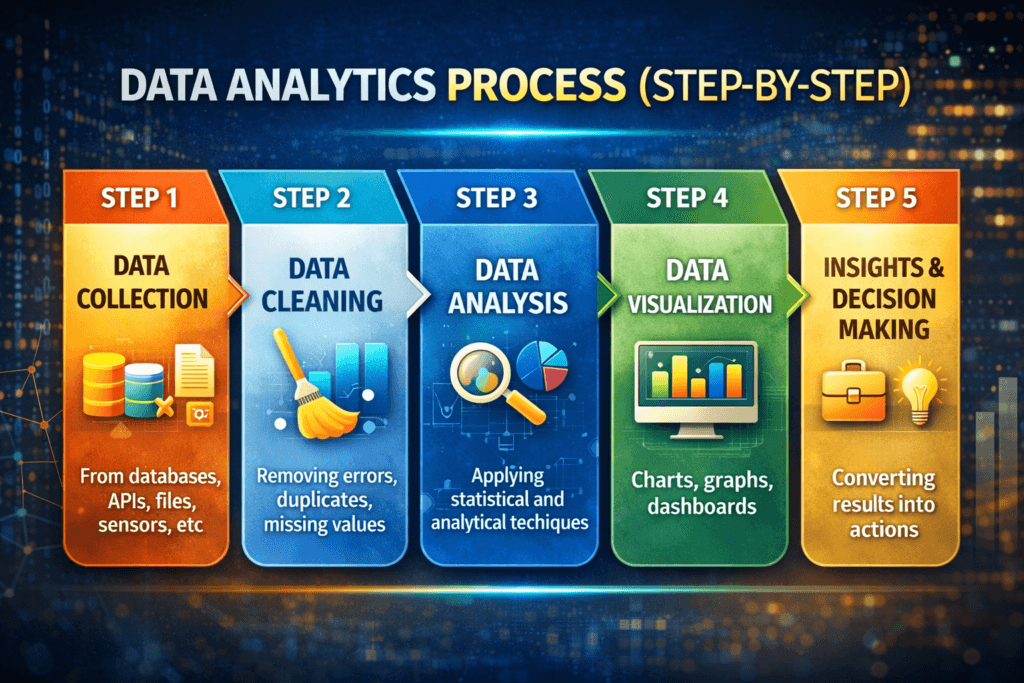
- Data Collection
From databases, APIs, files, sensors, etc. - Data Cleaning
Removing errors, duplicates, missing values - Data Analysis
Applying statistical and analytical techniques - Data Visualization
Charts, graphs, dashboards - Insights & Decision Making
Converting results into actions
Common Data Analytics Tools
| Category | Tools |
|---|---|
| Programming | Python, R |
| Databases | MySQL, PostgreSQL |
| Visualization | Power BI, Tableau |
| Data Handling | Excel, Pandas |
| Big Data | Hadoop, Spark |
💡 Python is the most popular tool due to its simplicity and powerful libraries.
Data Analytics vs Data Science
| Data Analytics | Data Science |
|---|---|
| Focuses on insights | Focuses on prediction |
| Uses structured data | Uses structured & unstructured data |
| Business-oriented | Research & AI-oriented |
| Less complex | More complex |
📌 Data analytics is often the entry point to data science.
Real-World Applications of Data Analytics
- 🏦 Banking – Fraud detection
- 🛒 E-commerce – Product recommendations
- 🏥 Healthcare – Patient data analysis
- 🚕 Transportation – Route optimization
- 📺 Streaming platforms – Content recommendations
Career Opportunities in Data Analytics
Some popular job roles include:
- Data Analyst
- Business Analyst
- Product Analyst
- Reporting Analyst
- Junior Data Scientist
Skills Required:
- SQL
- Excel
- Python
- Statistics
- Data Visualization
- Business Thinking
Who Should Learn Data Analytics?
Data analytics is ideal for:
- Students (Maths, CS, Commerce)
- Working professionals
- Business owners
- Career switchers
- Engineers & Developers
No advanced coding knowledge is required to start 🚀
A Practical Data Analytics Workflow
A useful analytics project starts with a clear business or research question rather than a particular tool. The workflow then moves from raw data to a validated dataset, analysis, communication, and an action or decision.
- Define the question: Decide exactly what needs to be understood or measured.
- Collect data: Identify reliable sources and document how the data was obtained.
- Clean the data: Handle missing values, duplicates, inconsistent formats, and obvious quality problems.
- Explore: Use summaries and visualizations to understand distributions, relationships, and unusual observations.
- Analyze: Apply appropriate statistical or analytical methods.
- Communicate: Present the result with charts, tables, and plain-language explanations.
- Act: Connect the finding to a decision, experiment, process change, or next question.
A Beginner Portfolio Project
A strong practice project does not need a huge dataset. For example, you could analyze an e-commerce orders dataset, calculate monthly revenue, identify the best-performing product categories, investigate returns, and build a dashboard. Document your assumptions, cleaning steps, formulas, and conclusions so another reader can reproduce the work.
Common Beginner Mistakes
- Starting with a chart before defining the question.
- Ignoring missing or inconsistent data.
- Confusing correlation with causation.
- Using averages when the distribution is highly skewed.
- Presenting numbers without explaining what they mean for the underlying problem.
Final Thoughts
Data Analytics is the backbone of modern decision-making.
Whether you want to improve business outcomes or start a high-growth career, learning data analytics is a smart investment.
👉 If you’re planning to start, begin with:
- Excel & SQL
- Basic Statistics
- Python for Data Analysis
Frequently Asked Questions (FAQ)
Q. Is data analytics hard to learn?
No. With basic math and practice, anyone can learn it.
Q. Do I need coding for data analytics?
Not initially. Excel and SQL are enough to start.
Q. Is data analytics a good career in 2026?
Yes! Demand is growing across all industries.